| Hour of Day Activity - techserv | http://techserv.sals.edu |
| Report Range: 1 Jan 2013 00:00 - 1 Dec 2017 23:59 (-5) |
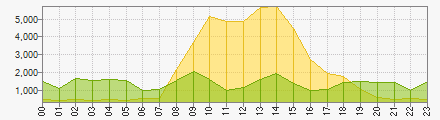
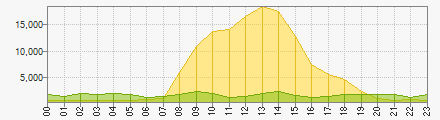
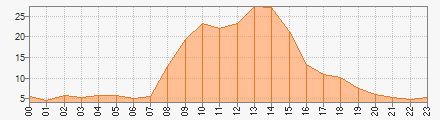
| This section shows the activity for each hour of the day for the report period. For example : if there are 2 days in the report period and both of them include a log entry for 8am, then the value shown is the sum of the hits for for both days. Values shown do not include failed requests. |
| Legend | Humans | Spiders |
| Visits by Hour of day | ||||
| ||||
| Page Views by Hour of day | ||||
| ||||
| Bandwidth by Hour of day | ||||
| ||||
| Hour of Day Activity | ||||||||||||||||||||||||||||||||||||||||||||||||||||||||||||||||||||||||||||||||||||||||||||||||||||||||||||||||||||||||||||||||||||||||||||||||||||||||||||||||||||||||||||||||||||||
| ||||||||||||||||||||||||||||||||||||||||||||||||||||||||||||||||||||||||||||||||||||||||||||||||||||||||||||||||||||||||||||||||||||||||||||||||||||||||||||||||||||||||||||||||||||||